Natural Disaster Trends 1900-2021
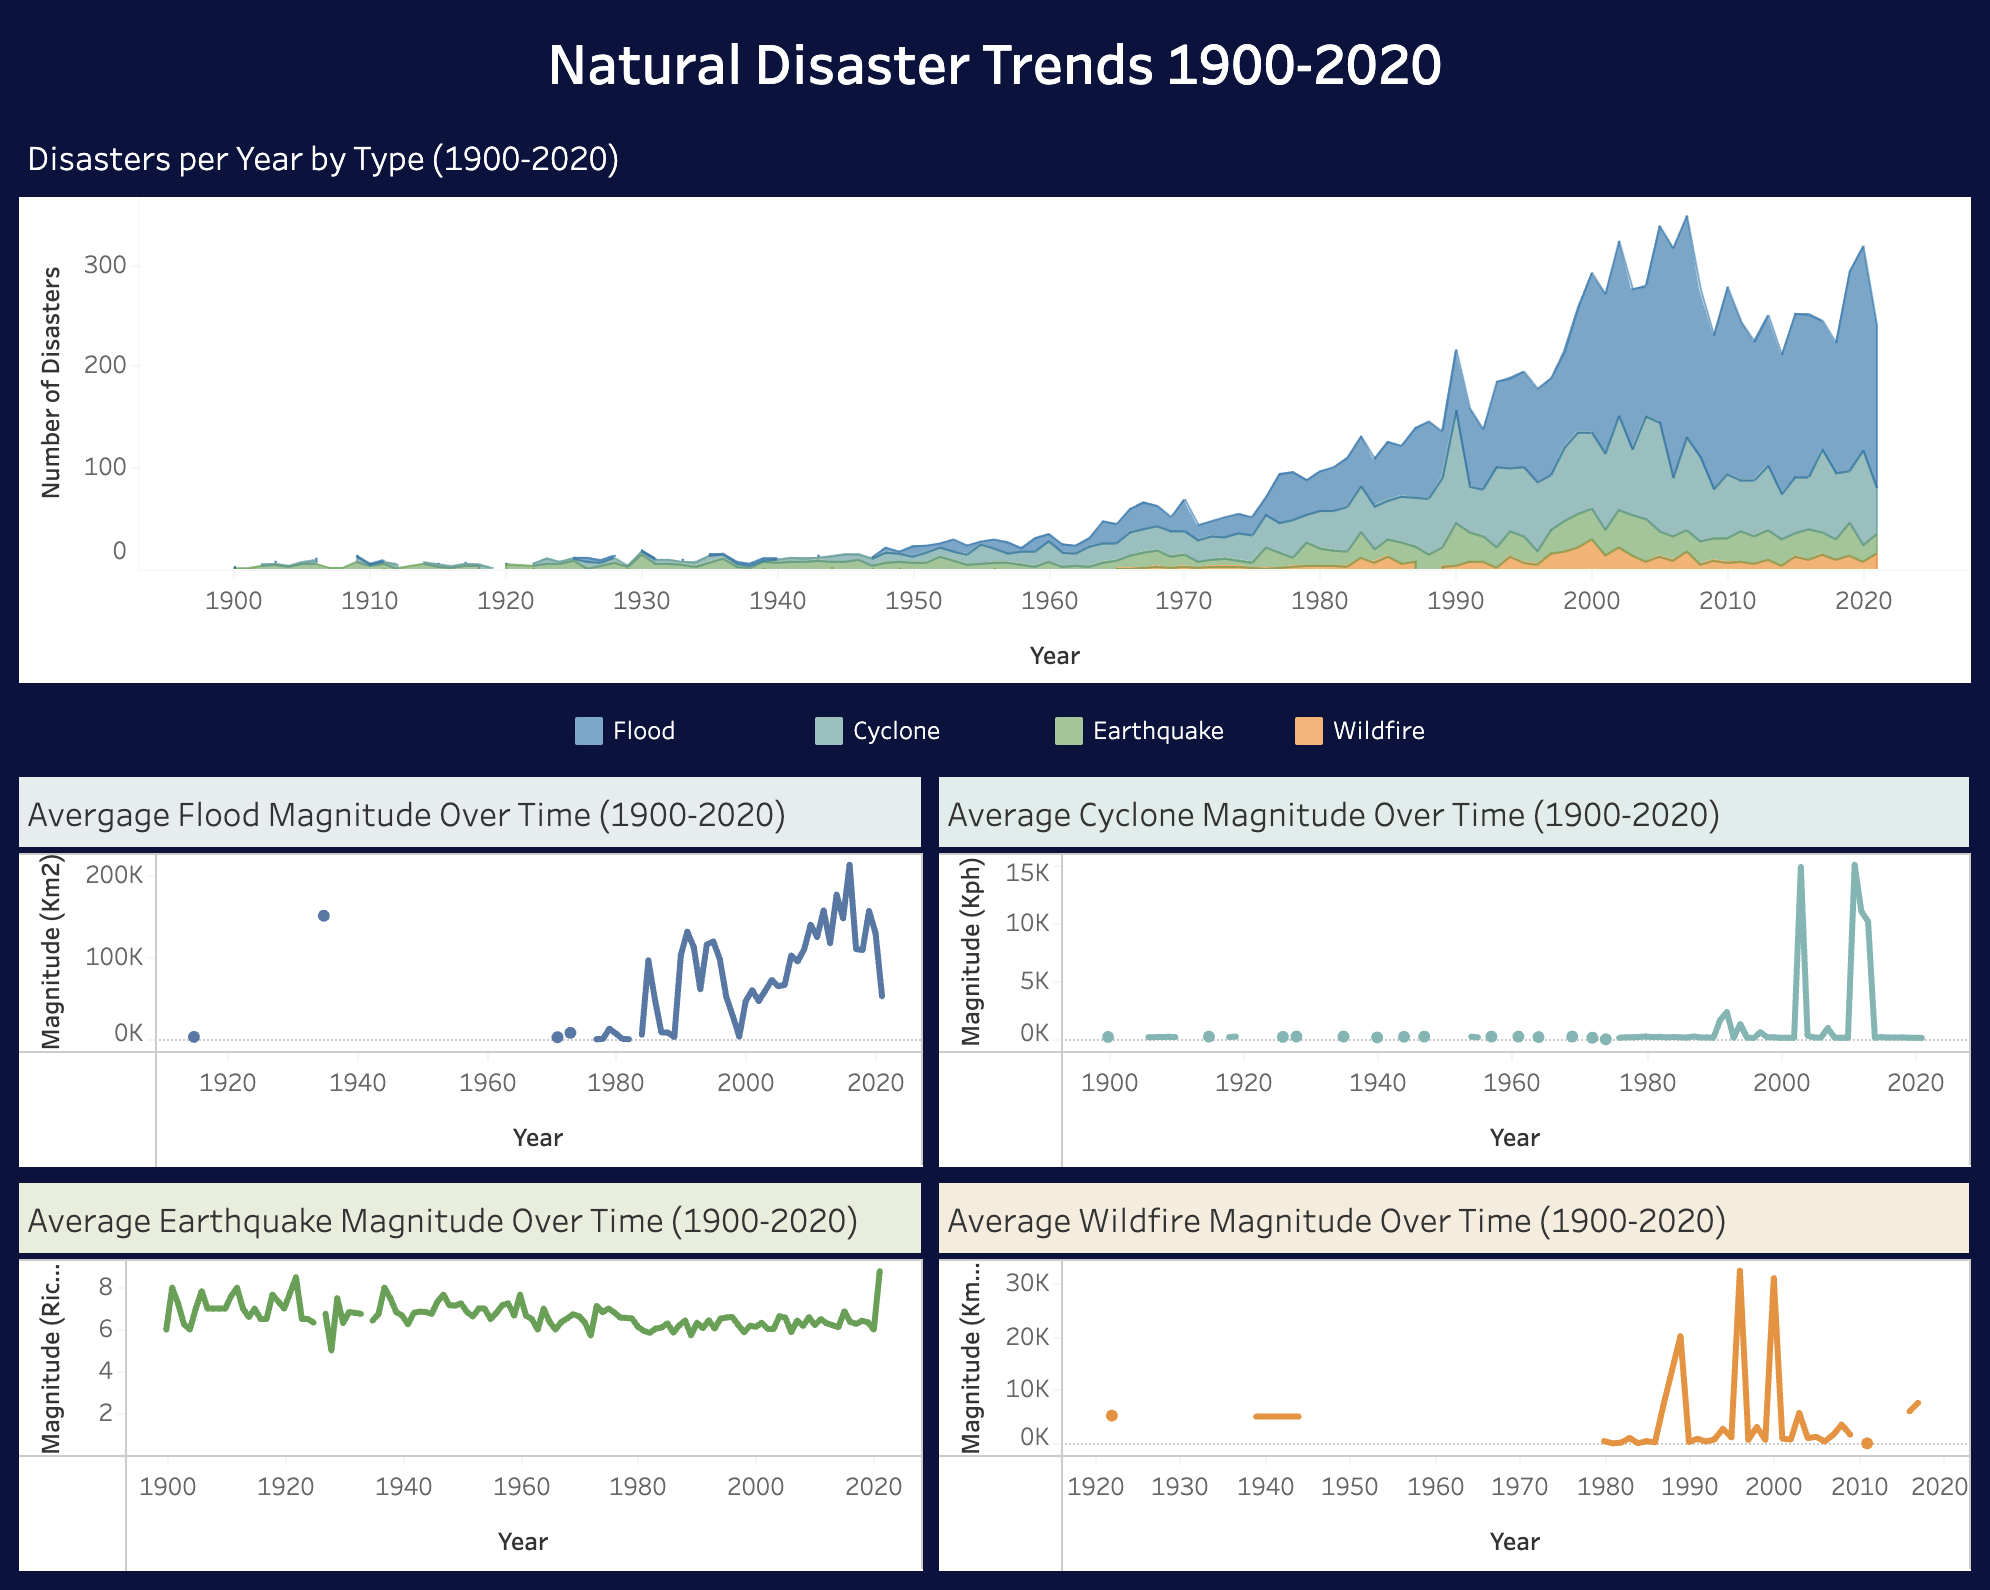
A prompt on Earth.Org inspired me to create this dashboard, which looks at trends in natural disasters. Specifically, I looked at the frequency and magnitude of floods, cyclones, earthquakes, and wildfires from 1900-2021.
Dataset: I found the dataset I needed on Kaggle: ALL NATURAL DISASTERS 1900-2021 / EOSDIS
Cleaning and Enhancing: I used Pandas to begin cleaning the data, using VSCode via Jupyter Notebooks. Once I got the data to a managable size, I finished cleaning and did my enhancing in Google Sheets.
Analysis: I imported my .csv to Tableau and used area and line visualizations to determine the scope of my project before creating my dashboard.